Overview of the North American Proppant Market
Market and Cost Review of Proppant


US review
According to the US Geological Survey (USGS), over 63% of sand mined in the United States is used for frac. This role of sand is constantly increasing within the proppant market (a proppant is a solid material that is designed to keep an induced fracture open). Its current share in the proppant market by volume is standing at 97%, and pretty much equally split between and white and brown types of sand. Sand’s value in the total proppant market value was 59% in 2014 and is expected to grow to 86%.
Not only share of sand, the cheapest proppant, grows within the North American proppant market, but also proppant market itself should grow to $6.0 billion by 2022, a nearly 50% increase since 2017, according to IHS.
Canadian review
IHS Markit believes Canadian proppant demand will remain roughly 4-5% of total North American proppant demand through 2023. Spears and Associates believes that this number is 14%. It would be surprisind to state that two third of Canadian demand is in the Montney, Duvernay, and Deep Basin. Much like US proppant demand, the majority of Canadian demand is – and is expected to remain –originating from sand demand at roughly 90%.
Share of sand, the cheapest proppant, grows within the North American proppant market
Logistics
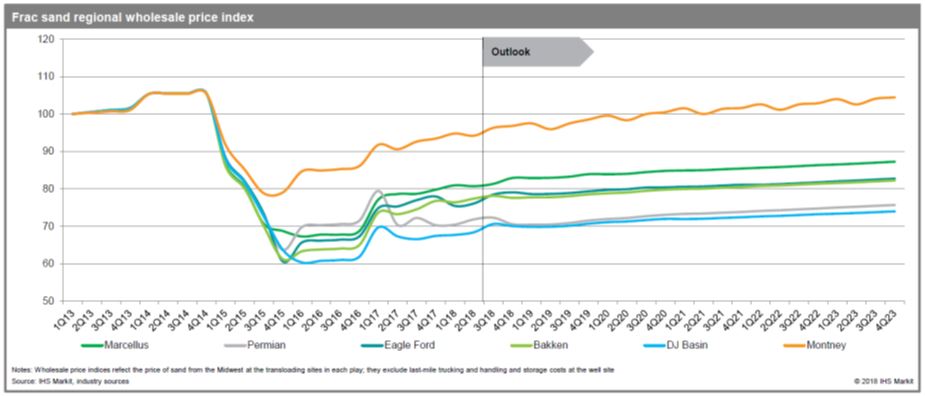
Logistics solutions and the proximity of supply become the main focus of cost savings and innovation, while oversupply provides opportunities. During boom, demand for proppant increases above supply level, pushing prices much up. Prices quickly drop when market cools off. This is a very volatile market, driven mainly not by price but availability.
This is a very volatile market, driven mainly not by price but availability
Proximity has become a highly valued piece of the total cost value chain. Value can be – and is – derived from shorter hauls, quicker truck turns, and higher turnover on location, which potentially can also lead to fewer trucks required, therefore fewer trucks on the road for the sake of congestion and safety, and potentially minimized or eliminated demurrage.
According to IHS, there is roughly 56 million tons of current regional and ‘in-basin’ sand capacity available to serve the Permian. This unfortunately entered the market quickly, and at a bad time given the looming activity moderation. This has resulted in oversupply. Logistics cost from source to wellhead account for the bulk of total cost, particularly for NWS, as distance traveled (proximity) is directly related to added costs such as rental charges, fuel surcharges, demurrage, transload costs, and more. Proximity of supply is the key, with the cash landed at well-site (CLAW) made up of dynamic components that present both opportunities and challenges. Below table portrays examples of NWS 20/40 shipped via rail originating in Wisconsin, to the wellsite.
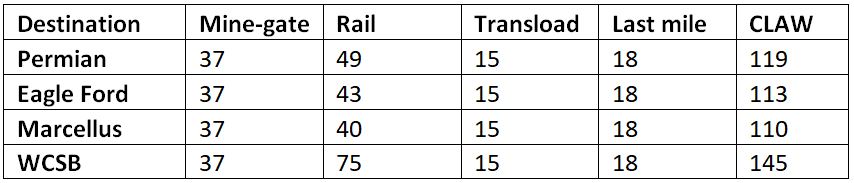
For a typical Northern White, 33% of cost is price at source mine, 47% is train/barge and 20% is trucking and storage. For local brown, 69% is price at source and 31% is trucking and storage.
The proppant delivery market is shifting from pneumatic trailers to proppant in a box. The driver of this dramatic change across the country is both environmental and economic. According to Spears and Associates, in mid‐year 2017, about 15% of all frac jobs performed in the US used a box delivery system. In Q2 2018 40‐50% were using box delivery systems. In 2019, we project that 60% will be box delivery systems.
Summarizing…
- Proximity has become a highly valued piece of the total cost value chain.
- Almost 70% of frac sand cost is logistics.
- According to US EIA, DUC inventory increases every month by 150 wells, 120 wells of which are in Permian. This will drastically increase demand for frac sand in Permian in the near future, after logistical bottleneck is removed (limit in production due to pipeline, train and road capacity constraints), frac sand delivery limit due to road capacity limitation, etc.
- Average oil production will increase from current 10.7MMb/d to 13.6-14.5 range, shifting demand for frac sand up.
- Higher demand for frac sand is in Permian that delivers most of new wells in North America.
- Frac stages, lateral length and volume of proppant pumped increases, thus, increases frac intensity per well.
- Those who manage logistics, manage proppant’s supply chain.
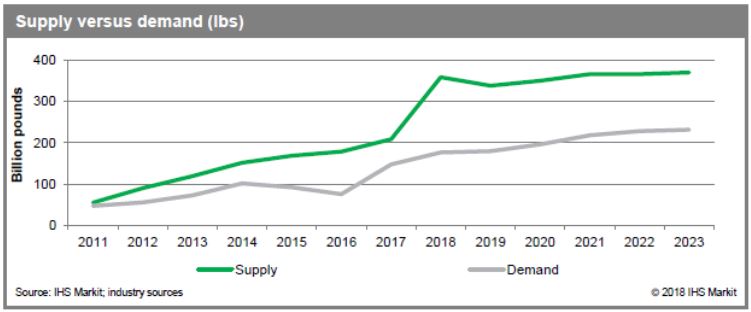
- The market is oversupplied with frac sand and demand/supply equilibrium will not be achieved in the foreseeable future.